Working together to improve teaching, learning and assessment Leagan Gaeilge
Leaving Certificate ›› LC Probability & Statistics
The aim of the probability unit is two-fold: it provides certain understandings intrinsic to problem solving and it underpins the statistics unit. It is expected that the conduct of experiments (including simulations), both individually and in groups, will form the primary vehicle through which the knowledge, understanding and skills in probability are developed. References should be made to appropriate contexts and applications of probability.
It is envisaged that throughout the statistics course learners will be involved in identifying problems that can be explored by the use of appropriate data, designing investigations, collecting data, exploring and using patterns and relationships in data, solving problems, and communicating findings. This strand also involves interpreting statistical information, evaluating data-based arguments, and dealing with uncertainty and variation.
-Leaving Certificate Syllabus page 15
General Resources for Probability and Statistics
The following teaching and learning plans are available:

Correlation Coefficient Correlation Coefficient (PPT)
Inferential Statistics for Proportions Inferential Statistics for Means


The Census at School Resources and Guide Page contains an overview of how to use Census at School for the teaching of Statistics.
Resources from the Junior Cycle page may be useful for teaching the Foundation Level Syllabus.
Some useful resources for teaching Probability and Statistics can be found on the Workshop and Event Resources Page, in particular, NQT Workshop 2 (2018 – 2019), Project Maths Workshop 1, Workshop 5, Workshop 10 and Modular Course 1 (2008 – 2015).
GeoGebra tutorials on using the Spreadsheet View and Probability Functions may useful for the teaching of Probability and Statistics.
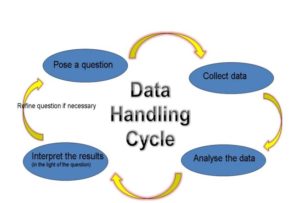
A document on the Data Handling Cycle provides a comprehensive overview of the data-handling cycle; gathering data, classification of data, graphical representation and analysis of data.
These mindmaps present a summary of the statistical concepts for Leaving Certificate Ordinary Level and Leaving Certificate Higher Level.
There are a range of lesson plans developed by teachers available in our Lesson Study Library.
There are a range of resources created by teachers available on Scoilnet to support teaching and learning of Probability and Statistics.
Resources by Syllabus Outcome

Outcome 1.1

Counting


Topic: Permutations and Combinations

This teaching and learning plan was developed by teachers to investigate applying the Fundamental Principle of Counting and n! to understand the formulae for nPr and nCr.
This student activity uses the Fundamental Principle of Counting to count permutations and contains an activity on probability using playing cards.
 

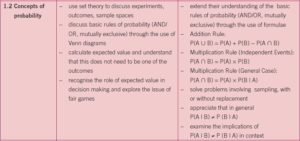
Outcome 1.2

Concepts of Probability


Relative Frequency 

This excel file can be used to investigate relative frequency. Divide the class into groups (G1, G2 etc). Each group tosses a die 30 times and the frequency of each outcome is entered into the spreadsheet. When all the data is entered click the “Completed” tab to show relative frequency approaching theoretical probability.
This GeoGebra file allows students to use a virtual spinner to investigate the relationship between probability and relative frequency.

Expected value

This presentation and worksheet on expected value introduce expected value through activities from Project Maths Workshop 10.
This GeoGebra file can be used for showing that the expected value is the long term mean value.
 

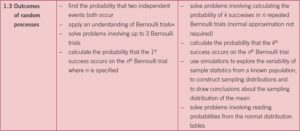
Outcome 1.3

Outcomes of Simple Random Processes


Binomial Distribution

This presentation is a Teaching and Learning Plan on binomial probability.
 

Outcome 1.4

Statisitical reasoning with an aim to becoming a statistically aware consumer
 

Collection, Analysis and Summarising Data

This summary sheet is a two page document from Project Maths Workshop 5 outlining all the stages of a statistical investigation.
 

Outcome 1.5

Finding, collecting and organising data


 Organising Data

A short spreadsheet with numerical and categorical data. See also the accompanying notes explaining the use of Excel formulae for numerical analysis.
These presentations are on graphical analysis of data and contain an accompanying teaching and learning plan with activity sheets.
 

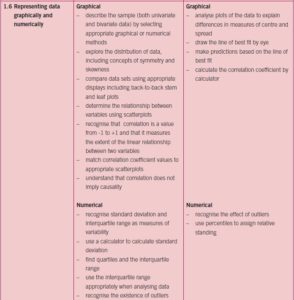
Outcome 1.6

Representing data graphically


Graphical Representation

This poster displays the different ways to represent data graphically.

Measures of Spread

These animated powerpoints explain quartiles in context using heights of people and using spaghetti.
This powerpoint uses unifix cubes to explain the mean and its connection with standard deviation.

Investigating Correlation

This task encourages students to investigate correlation. The Student Task PDF contains a worksheet investigating relationships. There is a link to a GeoGebra File, instructions on how to plot the line of best fit and some extension questions. There is an additional GeoGebra File (2) for investigating the line of best fit.
This resource booklet from Project Maths Workshop 5 can be used with this GeoGebra file to investigate the line of best fit.

Investigating Bivariate Data

This teaching and learning plan uses students’ own bivariate data analysed using scatter plots.
This Video shows a group of students investigating bivariate data.
 

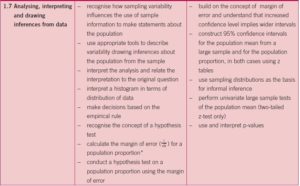
Outcome 1.7

Analysing, interpreting and drawing inferences from data

Empirical Rule

This Instructions Manual explains how to use GeoGebra to investigate the empirical rule.
This student activity is on verifying the empirical rule from Project Maths Workshop 5.
This poster shows the empirical rule.
These student activities look at applying the empirical rule to the results of an aptitude test and to phone networks.
 

Inferential Statistics

Presentation 1 and Presentation 2 look at inferential statistics.
This presentation looks at hypothesis testing using a 95% confidence interval and margin of error.
These worksheets from Project Maths Workshop 10 are on inferential statistics and hypothesis testing.
These GeoGebra files are for investigating the distribution of sample proportions and sample means and investigating the central limit theorem.
These videos are of a live class investigating normal distribution and sample means and standard error with comments from teachers and students.
 
  • New to projectmaths.ie